|
When hardware or software architectural components are stressed to their limit under carefully controlled test conditions, we can quantify and visualize their breaking points. One of the results from such testing is a set of characterization canopies (another example result is the causality graphs of failures). These canopies can be used, along with the system operating point within a parameter space to empirically calculate available engineering margins. Continuing with our structural engineering analogy, this is similar to varying the application environmental parameters such as temperature, humidity and discovering what application stress levels (and/or vibrations) induce a failure, and estimate margins. 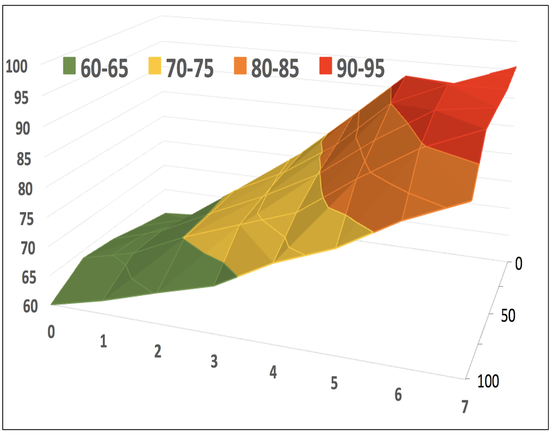 Shown is an example of characterization canopy from a processor component: the last-level cache (LLC) in a multi-core processor. The Figure shows observed core utilization (in Z axis), as each core is loaded (in X axis), while studying its sensitivity to a 3rd parameter (in Y axis) – in this case, the application read-write mix. This 3D graph has been colored to visualize the safe operating regions within this slice of the parameter space. For this graph, other parameters must be fixed at some values (including the memory demand and nominal processor load); but are varied in the overall experiment. Various such slices can be created from data obtained from millions of experiments. Assuming ‘correct’ application logic (to be visited for another day), these tests allow a careful study of stress saturation on the system operating environment either during system development or events such as component replacement, cyber-attacks that may overwhelm resources, etc.
Modern mobility platforms – such as automobiles, aircraft, drones, ships and spacecraft – have very complex computing and control systems onboard. Even subtle failures in these deployed systems – either in hardware, software or their configuration – can lead to serious consequences. They need to undergo extensive testing and certification to ensure that they maintain high performance, safety and security under all conditions encountered in the field. Such systems consist of many Commercial Off the Shelf (COTS) hardware, software and middleware components as well as application specific software. Figure below is an illustrative example of hardware and software architecture, representative of many mobility platforms. All boxes and lines, except the one termed “Application Program” are components, either COTS or internal. Choosing the correct components, configuring them correctly, and operating them within the bounds intended by the supplier is vital. When changes are made to the architecture at each technology refresh, the same process needs to be repeated 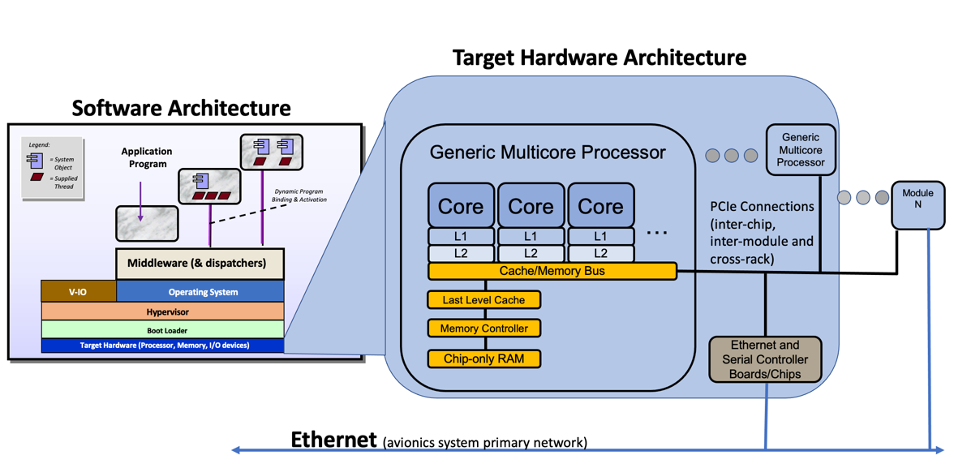 In structural engineering, a practice that has been around for millennia (since the days of the pyramids) is to carefully evaluate the constituent components for various environmental and operating stress conditions to ensure that (a) for all intended operating parameter ranges, the materials and components will hold up, and (b) there are adequate available engineering margins for various operating conditions. As a modern example, for airframe structures, the composite materials themselves are tested for a range of operating temperatures, pressures, stresses, vibrations etc.; the interfaces between components – e.g., rivets and glue – are evaluated for their respective operating ranges. Material and component characterization graphs resulting from such tests can then be used to evaluate available margins for the overall integrated system.
A methodical, Digital Engineering approach to the development and standardization of component characterizations can significantly cut down program costs and risks during component selection, integration, testing and sustainment phases Check out our nSure offering. Get Started with nGage. Contact Us! |